Written by: Jim Lawrence, Economy-Wide Statistics Division
The U.S. Census Bureau releases data every year describing changes for businesses operating in the United States. This infographic shows the number of jobs created by startups annually between 2004 and 2014, as well as job creation from startups as a percentage of total U.S. employment for 2006 and 2014. Figure 1 shows job creation from startups as a percentage of total U.S. employment for each year between 2004 and 2014.
Figure 1: Job Creation from Startups as a Percentage of Total U.S. Employment From 2004 to 2014

The percentages in Figure 1 might not fully demonstrate the role of startups in overall employment growth in the United States. This is in part because these percentages represent a comparison of job creation, which is a ‘flow’ measure, to the employment level, a ‘stock’ measure. A flow measure like annual job creation is a measure of change, which is applied to the level of employment each year. The stock of employment in the United States in any given year, therefore, represents the accumulation of net employment flows for each of the years preceding it.
An alternative way to assess the impact of job creation from startups is to compare it to another flow measure. One option would be to compare it to gross job creation, defined as the total number of jobs created in a given year by all establishments combined, including establishments that constitute startups. We define an establishment as a single physical location at which business is conducted or services or industrial operations are performed. It is not necessarily identical to a company or enterprise, which may consist of one or more establishments.
The converse of gross job creation is gross job destruction, which is defined as the total number of jobs destroyed in a given year by all establishments combined. By definition, establishments that constitute startups do not destroy jobs. The difference between gross job creation and gross job destruction represents yet another way to compare the impact of job creation for a given year, net job creation. For example, according to the 2014 Business Dynamics Statistics, gross job creation in the United States in 2014 was 16.0 million and gross job destruction was 13.3 million. The difference, 2.7 million, represents net job creation for the year.
In terms of whether it is preferable to compare job creation from startups to gross job creation or net job creation, an argument can be made that it is preferable to use gross job creation. This is because startups only create jobs and do not destroy them. Therefore, they do not have a net job creation number associated with them in the way that nonstartup firms do. In this sense, job creation from startups can be seen as a gross number and should therefore be compared to gross job creation, versus net job creation.
Figure 2 shows job creation from startups as a percentage of gross job creation for 2004 to 2014.
Figure 2: Job Creation From Startups as a Percentage of Gross Job Creation From 2004 to 2014
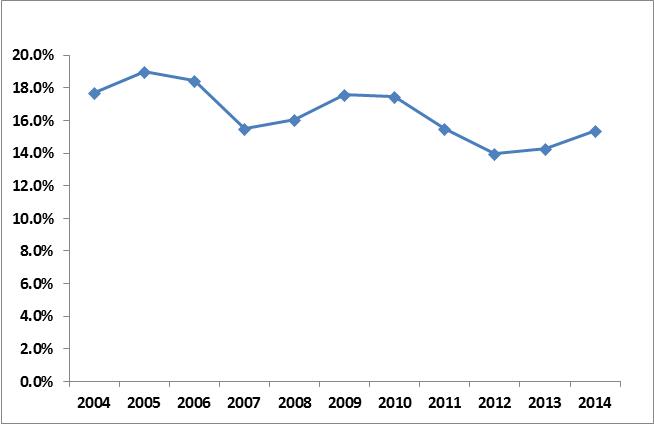
The percentages in Figure 2 fluctuate between a high of 19.0 percent in 2005 to a low of 13.9 percent in 2012. These percentages are much higher than in Figure 1, which fluctuate between a high of 3.0 percent in 2006 to a low of 1.9 percent in 2013. The significantly higher percentages in Figure 2 demonstrate that job creation from startups, as seen in the context of gross job creation, make a larger contribution to employment growth in the United States than is implied by Figure 1.
If you want to learn more about employment growth, job creation and other statistics impacting business in the United States, visit the Business Dynamics Statistics web site.